Math II presentations
 My Math II class did their presentations today. They were required to do a project on TV commercials. They had to watch TV for one hour a day, at the same time and record how many different commercials showed. We used frequency tables to keep track of the information and then they made bar graphs out of their results. Some of them were very creative. For example, one group showed a piece of the telenovela they saw or another group did a drama on how commercials affect us. It was great!
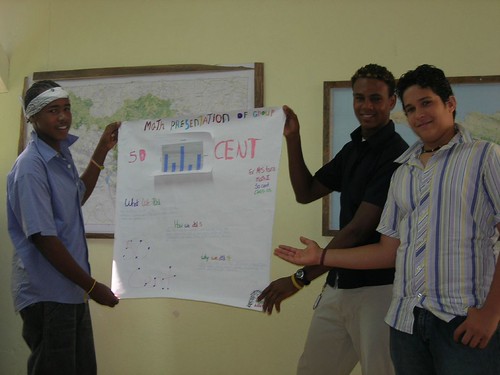
This is a picture of Group 50 Cent (Victor, Adelso, and Julian). Check out the rest of the pics on my Flickr link to the right.
posted by Braulio and Tara Payano @ 8:19 AM
0 comments
![]()
![]()


0 Comments:
Post a Comment
<< Home